Assessment Summary Single Student View
Assessment Summary: Single Student View
The Single Student View in Assessment Summary allows you to review an individual student's attainment and progress across multiple academic years, subjects, and assessment periods. This makes it easy to identify trends over time and export the data for further analysis.
Accessing Single Student View
Go to Assessment Summary.
Select Single Student View.
Configure your report
Before generating the report, choose the filters you want to apply.
Academic Years
Select one or more academic years to include in the report.
For example, you may wish to select all of the years the student has attended your school to view their attainment and progress over time.
Assessment Periods
Select the assessment windows (terms or half-terms) you want to include, such as:
Autumn 2
Spring 2
Summer 2
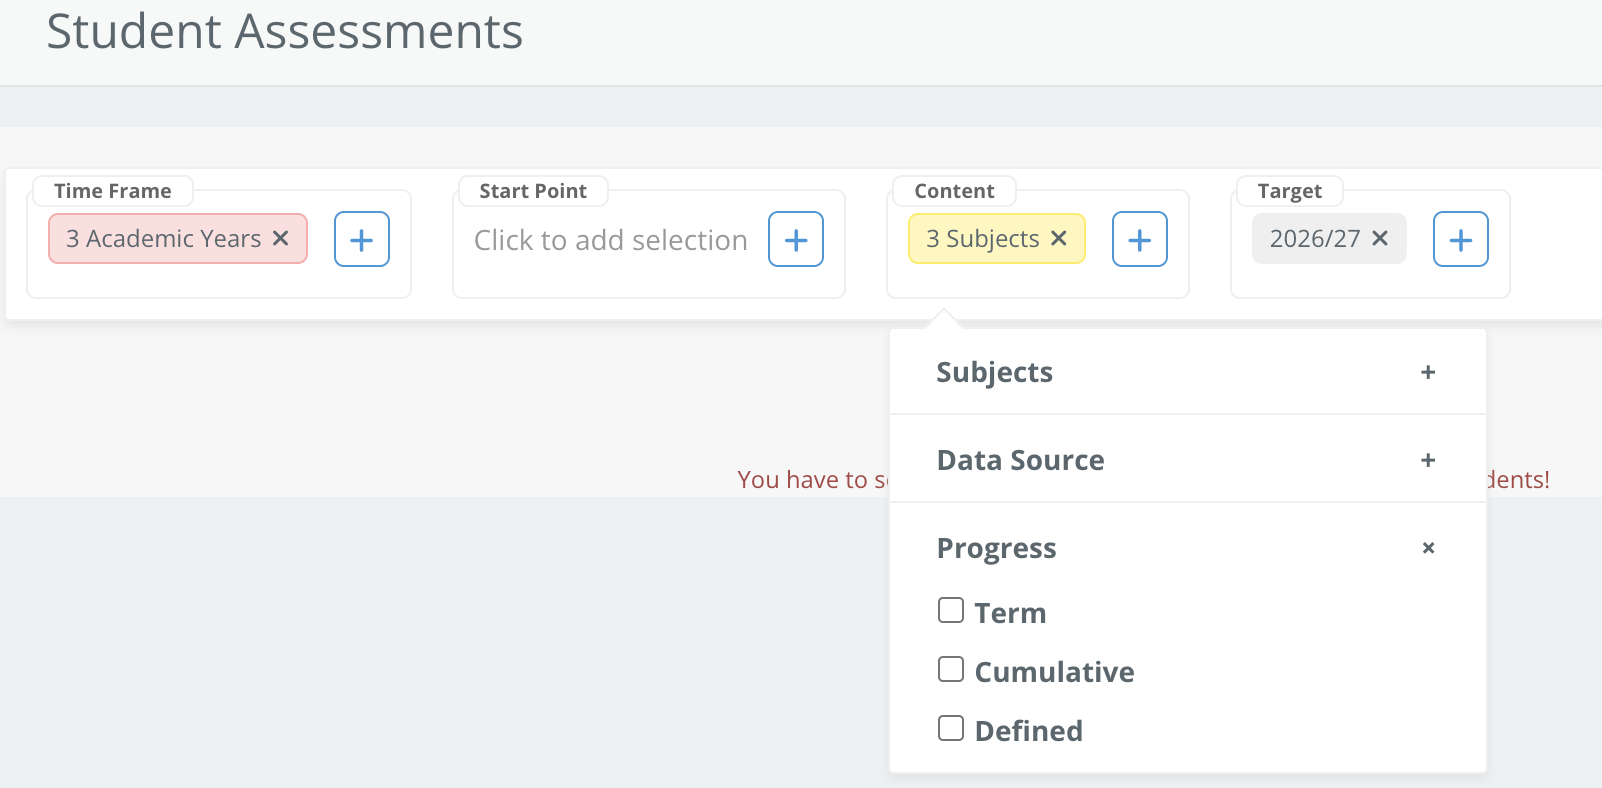
If Defined Progress is enabled on your site, you will also have the option to select Start Point.
Note: If you do not have Defined Progress enabled, simply continue using the standard progress options.
Subjects
Select the subjects you want to include in the report.
Data Source
Choose which assessment data you want to display.
Calculated and Teacher Judgments
Displays the calculated judgement by default.
If a teacher has entered a manual judgement override, the teacher judgement is shown instead.
Calculated
Displays calculated judgements only.
Judgements are generated automatically using your site's expectations and coverage model.
Teacher Judgments
Displays only manually entered teacher judgements.
These are entered via Classes & Groups > Teacher Judgement.
Progress Type
The available progress types depend on your site's configuration.
Cumulative
Progress is recalculated from the assessment data at each assessment point.
Useful for viewing progress over time.
Term
Displays the judgement for the selected term (for example, Autumn 2, Spring 2 or Summer 2).
Defined
Only available if Defined Progress has been enabled for your site.
Want to use Defined Progress? Contact the Learning Ladders Support team if you'd like this feature enabled.
Class and Student
Select the class you want to search.
Load the students in that class.
Select the required student.
Click Generate.
Understanding the results
The report opens in Table View.
The table displays:
The selected academic years
The selected subjects
The chosen assessment periods
Attainment and progress for each assessment window
Hover over any attainment or progress value to view the full descriptor assigned to that judgement.
This allows you to compare how a student's attainment and progress has changed over multiple years.
Viewing attainment as a graph
Select the Attainment tab to switch from the table to a graphical view.
The graph allows you to:
View attainment over time.
Compare assessment points across multiple academic years.
Display one or more subjects.
Click a subject name to show or hide it on the graph, making it easier to focus on individual subjects or compare several subjects together.
Hover over any data point to view the attainment judgement for that assessment period.
Viewing progress as a graph
Select the Progress tab to display progress over time.
The graph works in the same way as the attainment graph:
View progress across assessment periods.
Compare progress over multiple academic years.
Show or hide subjects by clicking their names.
Hover over data points to view the recorded judgement.
Exporting your data
Both the table and graph views include a three-dot (⋮) menu.
Use this menu to export or download the report. The table can be exported into .CSV format or downloaded and the graphs can be downloaded.
Clicking on the three lines on the chart itself brings download options in other formats e.g. PNG, JPEG, PDF or SVG Vector.
Need help?
If you have any questions about Single Student View or would like to enable Defined Progress, please contact the Learning Ladders Support team.